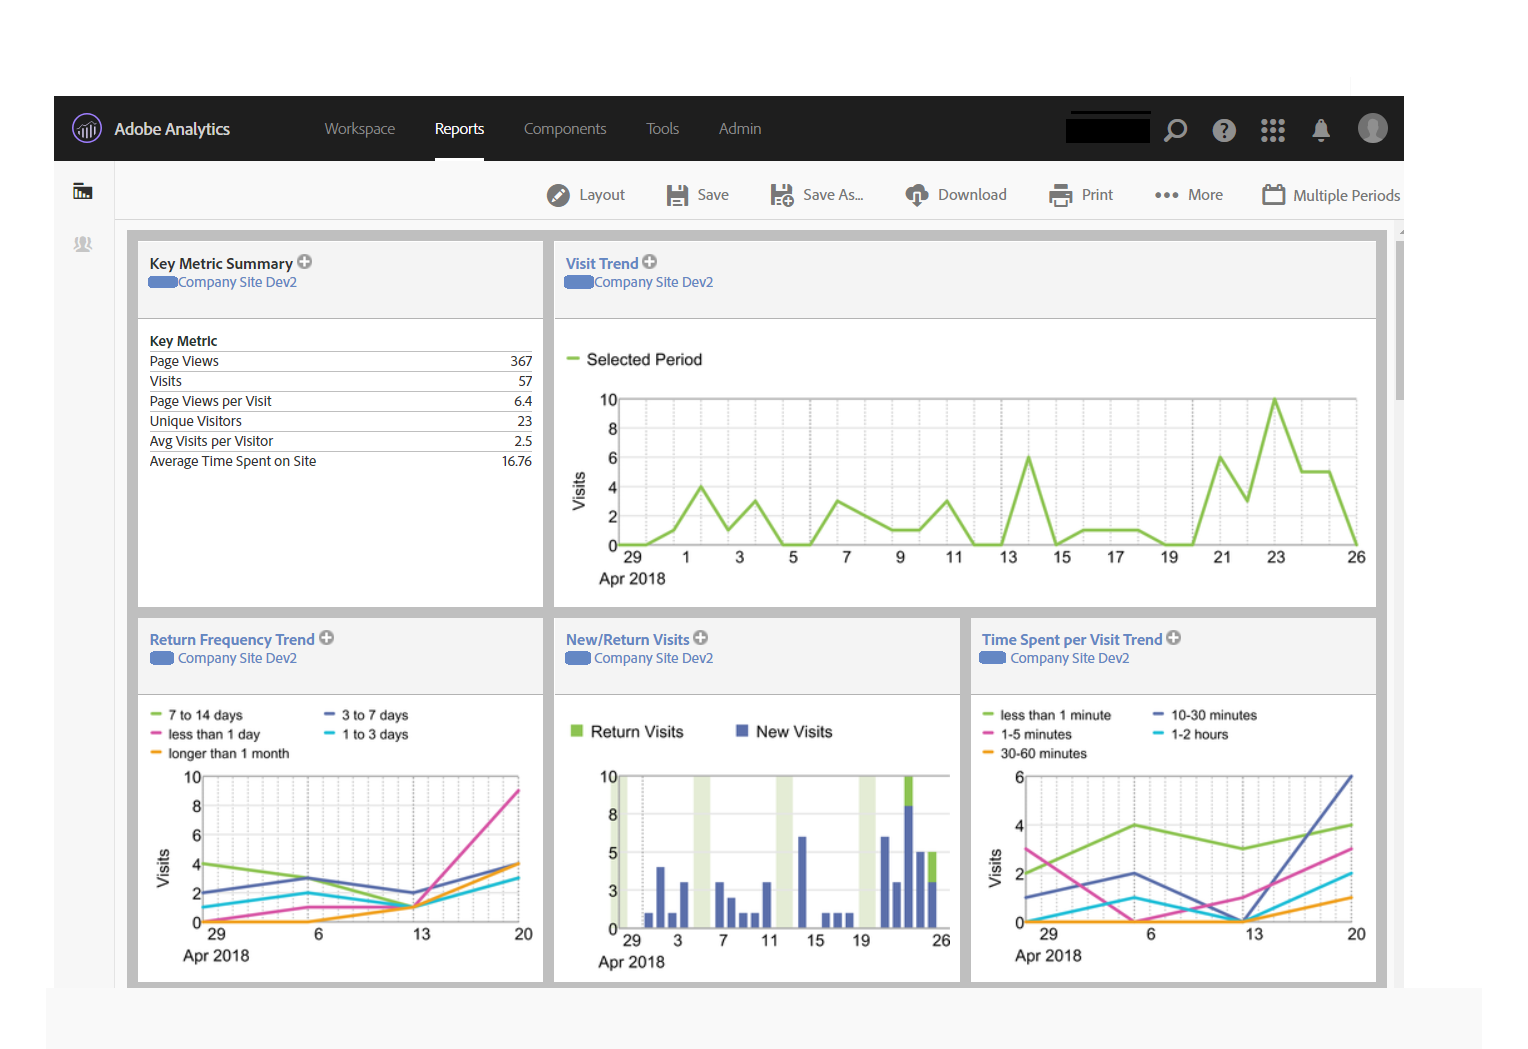
Because Adobe Analytics is so highly customizable, we all want the benefit of experience to develop the best data strategies for our analytics reports. After creating analytics solution designs for well over 10 years, I'd love to share some of my best practices for robust and scalable analytics reporting.

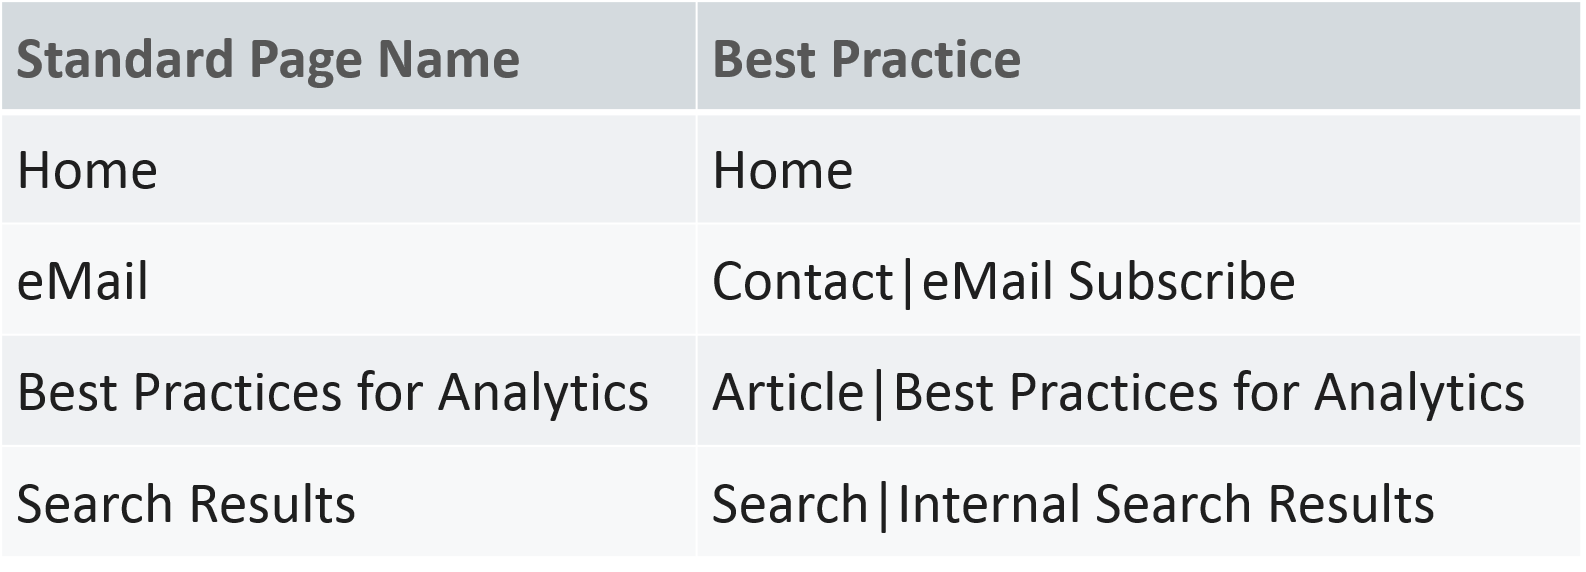
Think about what your page name report will look like. How will you recognize pages and understand where they live on the website? By incorporating the page location into its name, you can easily identify your pages and create an intuitive view for all report users.
For Example:
Next, use custom variables to capture the new "folder" names as Site Sections for summary reports.
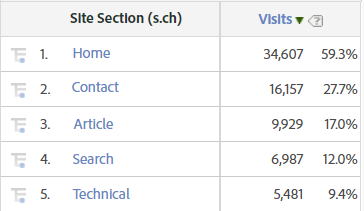
This level of aggregation can support;
1. Views of overall site traffic
2. Pathing analysis
3. Segmentation for custom calculated metrics
With the latest tally of 200 custom eVars and 1,000 custom events, we have a lot of customization to play with. Gone are the days of reserving a custom variable by checking the report suite and selecting next empty slot. With so much to work with, it makes sense to start with a plan.
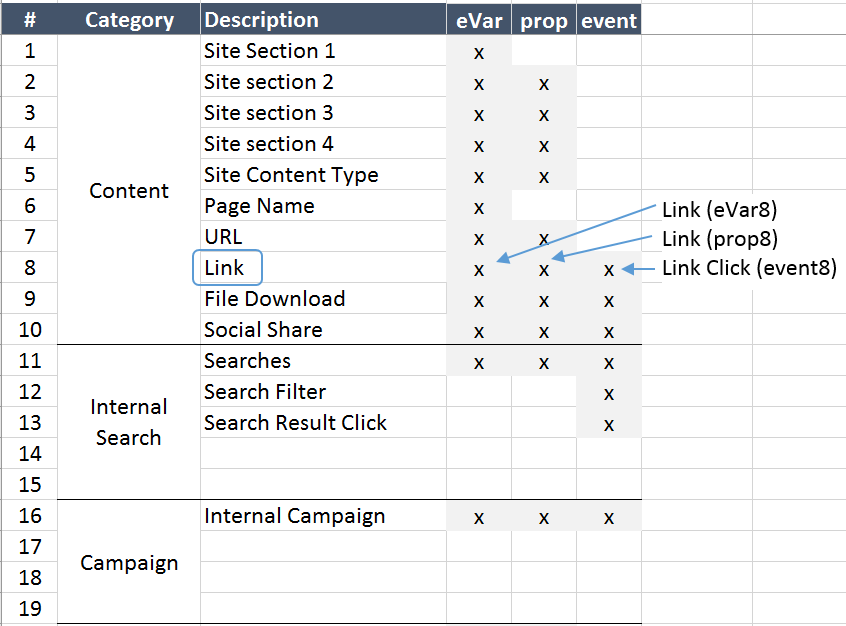
Step 1. Plan your solution design by creating a list. Reserve "blocks" of variables for reports of the same category.
For Example: You may like to reserve the first 10 variables for key reports related to "Site Content"
Step 2: Use consistent naming and numbering for all associated variables.
For Example: If you are creating Link tracking in eVar8, it makes sense reserve event8 for the link tracking success metric (link clicks). So it's best to use a template, like the one below, to draw up your plan.
It's also a good plan to save a few extra variable spaces for report categories that can grow.
For Example: You may some day expand Campaign reporting by using Adobe Analytics Data Connectors to import metrics from your Ad Server. This may require reserving a custom variable for additional report data.
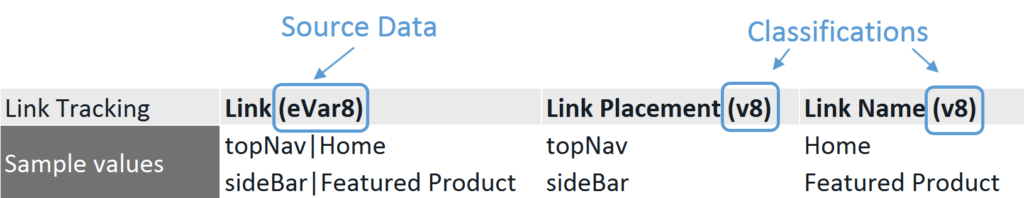
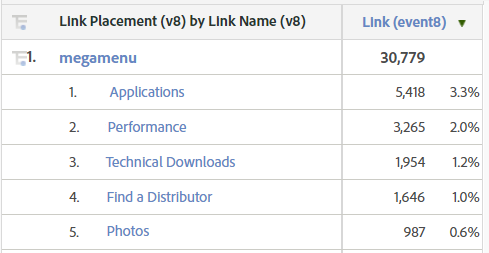
When we populate a single variable, we create the ability to report both, overall summary views and categorized reports. In this example, a single report will include all link activity on the same site. So, rather than creating a Header Link eVar and a Sidebar Link eVar, we place all the data in one Link eVar and include the link placement type in the data capture.
By compiling this data using a unique delimiter, we can use the Classification Rule Builder (in Adobe Analytics) to automatically parse data into classifications (reports).
Tip: 1. Scrub special characters from your data to avoid creating unexpected delimiters or sub delimiters. For example, you may compile your data using the pipe "|" delimiter as it's least likely to be found in your data, but as it may still occur, you don't want to capture it and create a new column in error. Also, special characters can mess with your classification rules and do not always convert correctly in your data. Example: Adobe reported this "Analytic’s:" when this was passed in an eVar/Prop "Analytic’s:"
2. Use a naming convention for the report names. The "Source Data" is what we pass to the variable, in this case eVar8. We use the full description for the source data "eVar#" and an abbreviation designates a classification "v#".
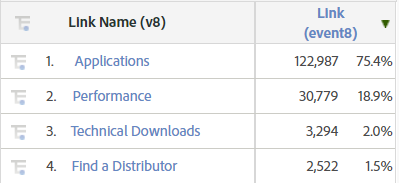
Most of the time we will be reading classification reports as they offer nice summary views of activity.
+ The data structure supports data correlations for more detailed views.
The Source data is very helpful when running diagnostics or reconciling results. We just need to remember that Classification Rules require a few hours to process, so it's good to keep this in mind when reporting current day results.