
I have a client that is a manufacturer of building supplies. Because their products are sold through a network of distributors, they do not engage in eCommerce. Their websites’ primary objective is to drive awareness of their products through offerings of: brochures, technical documents, videos, articles, tools and other product content. For this digital model, we defined performance as “website engagement” or the “consumption of digital content”, as this is an early indicator in the purchase funnel that indicates intent to purchase (offline).
We started by measuring engagement rates with Adobe Analytics custom calculated metrics. I created visit segments to build an initial selection of Key Indicators of Intent (KIIs).
For example: “% Visits w Video”
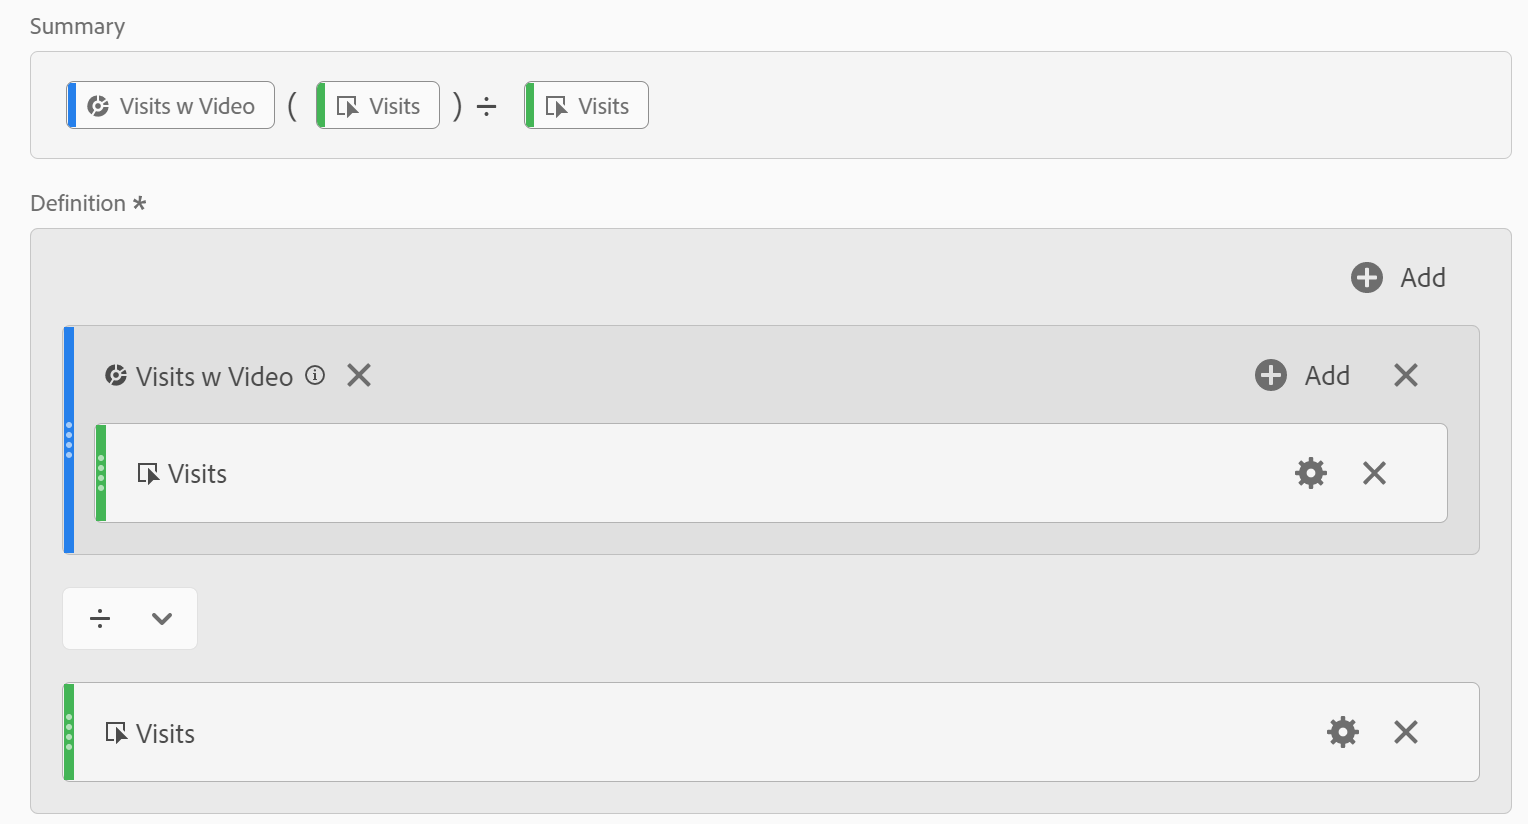
Note: We measure the % of visits that included the key engagement, rather than the total visits (that included the engagement) to create an indicator. Visit volume will fluctuate, and will, in turn impact the volume of visits with the engagement. This is why rate metrics are good Key Performance Indicators (KPIs).
Next, our KIIs were aligned with the website audience to define “agnostic” indicators. For example, contractors may come to the website to watch installation videos and designers may need some images from the galleries. So not all audiences will engage equally.
From a review of the site content, audiences and their typical journeys (planning, buying, constructing), agnostic KIIs where created. This included further defining some metrics.
For example: % Visits w Brochure Downloads” was added to further define “% Visits w File Downloads”.
This could be done by leveraging the well-planned data model that captured File Category as well as File Name in the Adobe Analytics custom File variable (as defined in this blog post: 3 Top Data Strategies for Adobe Analytics).
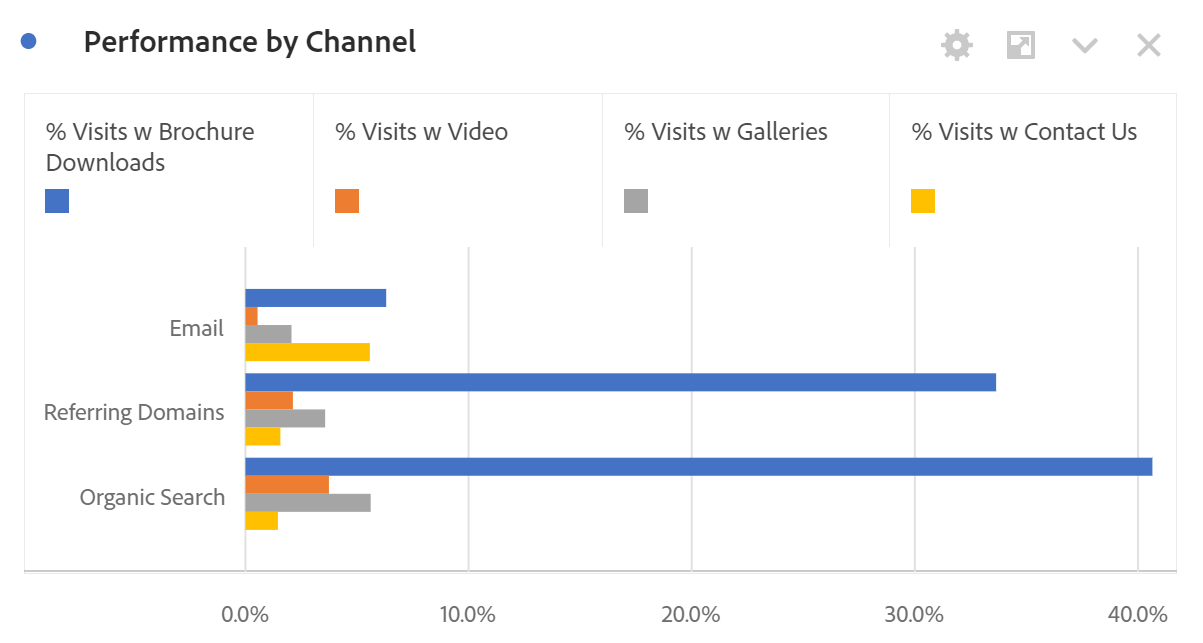
With these helpful indicators, performance reports were created for campaigns and other initiatives. As well, some baseline metrics were provided by creating reports of “all traffic” to use as a benchmark.
The collection of indicators were quite helpful, though, we were looking at quite a selection of metrics to determine performance.
So the next step was to create a single metric that would provide an overall score, or an “Engagement Score”. I created a list of all agnostic indicators and met with the business to “score” or assign value to each engagement. Each engagement was then rated on a scale from 1 to 10.
For example, a similar worksheet was prepared:

And a new calculated metric was created in Adobe Analytics using the advanced features.
Starting with calculations to score each engagement.
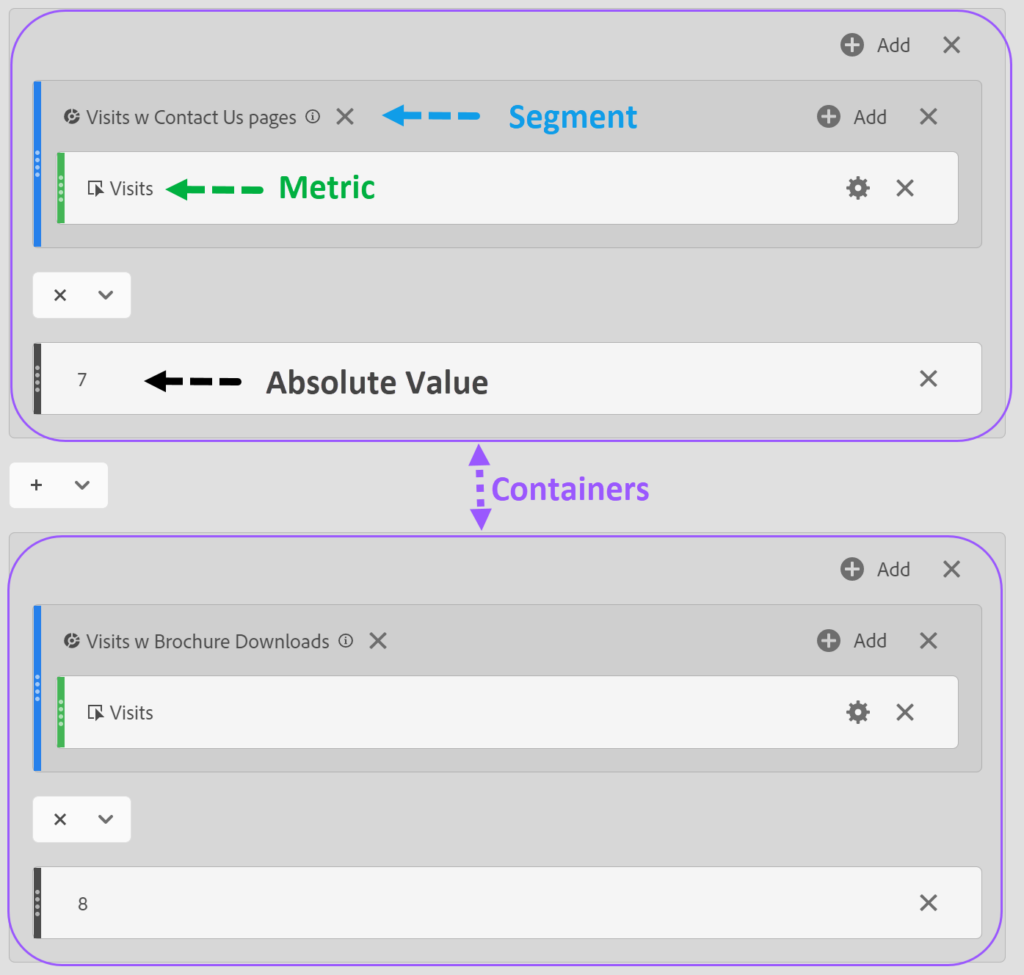
Note: Each score calculation is placed in a container to manage the “order of operation”.
Then nesting each score calculation in a larger container to create an “average” calculation. Here is what that looks like:
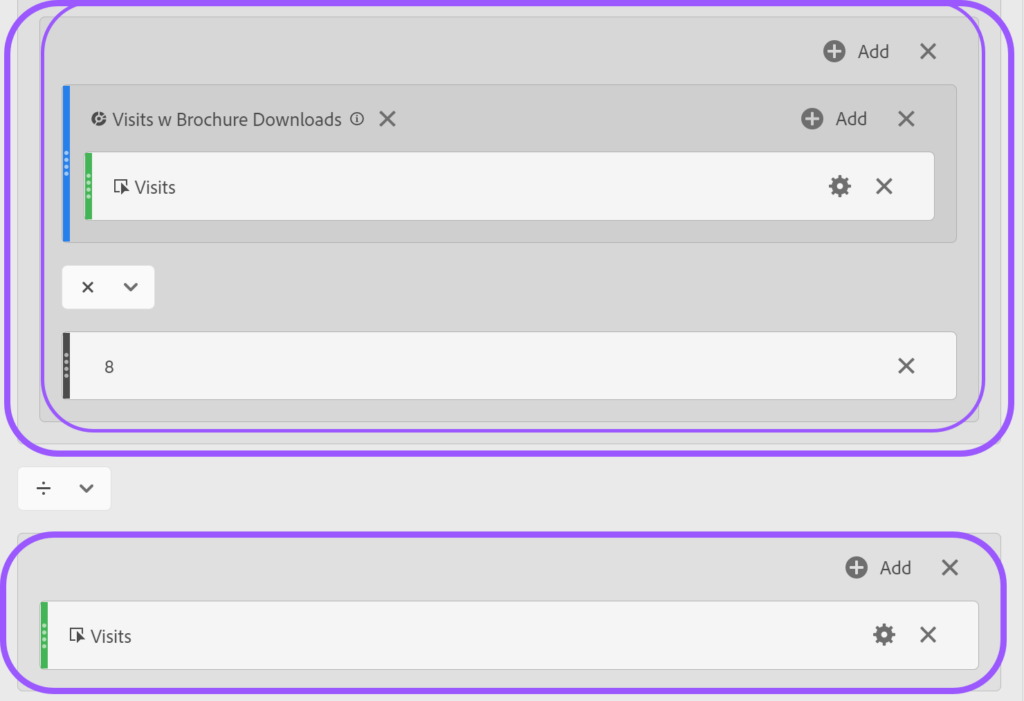
The resulting metric produced measures that we could evaluate and trend over time.
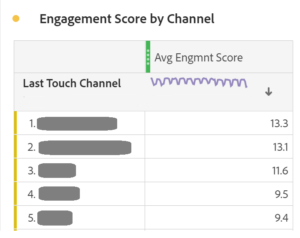
This was a big success and was widely adapted as a measure of record for digital performance.
I’d love to hear what you think. Is this something you’ve tried?